在腳本中搜尋"ma cross"
MA Cross 9 & 30 trend analysisvery good fro a simple trend analysis. 9 and 30 did work for me and I want to share.
Smart Money Concepts //@deepak
//@version=5
indicator(title='Custom Also Builder - v1', shorttitle="Custom Also Builder - v1", overlay=true, max_bars_back=500)
ma(_source, _length, _type) =>
switch _type
"SMA" => ta.sma (_source, _length)
"EMA" => ta.ema (_source, _length)
"RMA" => ta.rma (_source, _length)
"WMA" => ta.wma (_source, _length)
"VWMA" => ta.vwma(_source, _length)
alarm(_osc, _message) =>
alert(syminfo.ticker + ' ' + _osc + ' : ' + _message + ', price (' + str.tostring(close, format.mintick) + ')')
//Conditional Sampling EMA Function
Cond_EMA(x, cond, n) =>
var val = array.new_float(0)
var ema_val = array.new_float(1)
if cond
array.push(val, x)
if array.size(val) > 1
array.remove(val, 0)
if na(array.get(ema_val, 0))
array.fill(ema_val, array.get(val, 0))
array.set(ema_val, 0, (array.get(val, 0) - array.get(ema_val, 0)) * (2 / (n + 1)) + array.get(ema_val, 0))
EMA = array.get(ema_val, 0)
EMA
//Conditional Sampling SMA Function
Cond_SMA(x, cond, n) =>
var vals = array.new_float(0)
if cond
array.push(vals, x)
if array.size(vals) > n
array.remove(vals, 0)
SMA = array.avg(vals)
SMA
//Standard Deviation Function
Stdev(x, n) =>
math.sqrt(Cond_SMA(math.pow(x, 2), 1, n) - math.pow(Cond_SMA(x, 1, n), 2))
//Range Size Function
rng_size(x, scale, qty, n) =>
ATR = Cond_EMA(ta.tr(true), 1, n)
AC = Cond_EMA(math.abs(x - x ), 1, n)
SD = Stdev(x, n)
rng_size = scale == 'Pips' ? qty * 0.0001 : scale == 'Points' ? qty * syminfo.pointvalue : scale == '% of Price' ? close * qty / 100 : scale == 'ATR' ? qty * ATR : scale == 'Average Change' ? qty * AC : scale == 'Standard Deviation' ? qty * SD : scale == 'Ticks' ? qty * syminfo.mintick : qty
rng_size
//Two Type Range Filter Function
rng_filt(h, l, rng_, n, type, smooth, sn, av_rf, av_n) =>
rng_smooth = Cond_EMA(rng_, 1, sn)
r = smooth ? rng_smooth : rng_
var rfilt = array.new_float(2, (h + l) / 2)
array.set(rfilt, 1, array.get(rfilt, 0))
if type == 'Type 1'
if h - r > array.get(rfilt, 1)
array.set(rfilt, 0, h - r)
if l + r < array.get(rfilt, 1)
array.set(rfilt, 0, l + r)
if type == 'Type 2'
if h >= array.get(rfilt, 1) + r
array.set(rfilt, 0, array.get(rfilt, 1) + math.floor(math.abs(h - array.get(rfilt, 1)) / r) * r)
if l <= array.get(rfilt, 1) - r
array.set(rfilt, 0, array.get(rfilt, 1) - math.floor(math.abs(l - array.get(rfilt, 1)) / r) * r)
rng_filt1 = array.get(rfilt, 0)
hi_band1 = rng_filt1 + r
lo_band1 = rng_filt1 - r
rng_filt2 = Cond_EMA(rng_filt1, rng_filt1 != rng_filt1 , av_n)
hi_band2 = Cond_EMA(hi_band1, rng_filt1 != rng_filt1 , av_n)
lo_band2 = Cond_EMA(lo_band1, rng_filt1 != rng_filt1 , av_n)
rng_filt = av_rf ? rng_filt2 : rng_filt1
hi_band = av_rf ? hi_band2 : hi_band1
lo_band = av_rf ? lo_band2 : lo_band1
ma_function(source, length, type) =>
if type == 'RMA'
ta.rma(source, length)
else if type == 'SMA'
ta.sma(source, length)
else if type == 'EMA'
ta.ema(source, length)
else if type == 'WMA'
ta.wma(source, length)
else if type == 'HMA'
if(length<2)
ta.hma(source,2)
else
ta.hma(source, length)
else
ta.vwma(source, length)
// Get Table Size
table_size(s) =>
switch s
"Auto" => size.auto
"Huge" => size.huge
"Large" => size.large
"Normal" => size.normal
"Small" => size.small
=> size.tiny
setup_group= "████████ Indicator Setup ████████"
signalexpiry = input.int(defval=3, title='Signal Expiry Candle Count',group=setup_group, inline='expiry',tooltip="Number of candles to wait for all indicators to confirm a signal. Default is 3 which means if leading indicator print the signal, it will wait for max 3 more candles for rest of the indicators to print signal, if not then this setup is invalided and will have to wait for another signal form the leading indicator.")
alternatesignal = input.bool (true, "Alternate Signal", group=setup_group, inline='alternate')
showsignal = input.bool (true, "Show Long/Short Signal", group=setup_group,inline='showsignal',tooltip="Option to turn on/off the Long/Short signal shown on the chart. by default it will print Long/ Short signal on the chart.")
showdashboard = input.bool (true, "Show Dashboard", group=setup_group,inline='dashboard')
string i_tab1Ypos = input.string('bottom', 'Dashboard Position',group=setup_group, inline='dashboard2', options= )
string i_tab1Xpos = input.string('right', '', inline='dashboard2', group=setup_group,options= )
in_dashboardtab_size = input.string(title="Dashboard Size ", defval="Normal",
options= ,
group= setup_group , inline= "dashboard3")
///////////////////////////////////////////////
///// Signal filters
/////////////////////////////////////////////
leadingindicator = input.string(title="Leading Indicator", defval="Range Filter",
options= , group='████████ Main Indicator (signal) ████████', inline='li')
confirmation_group = "████████ Confirmation Indicators (filter) ████████ "
ema_tooltip = "EMA filter for confirmation.\n\n Validates Long signal if price is above the EMA FILTER level, and validates Short signal if price is below the EMA FILTER level. \n\nDefault is 200, you can change that to meet your requiremnt."
respectema = input.bool (false, "EMA Filter", group=confirmation_group, inline='respectema')
respectemaperiod = input.int(defval=200, minval=1, title='', group=confirmation_group, inline='respectema', tooltip=ema_tooltip)
ema2_tooltip = "Generates Long signal if Fast EMA cross above Slow EMA.\n\n Generates Short signal when Fast EMA cross below the Slow EMA.\n\n Default values are 50 and 200. you can change that to meet your requirement."
respect2ma = input.bool (false, "2 EMA Cross : ", group=confirmation_group, inline='2ma')
respect2maperiod_1 = input.int(defval=50, title='',group=confirmation_group, inline='2ma')
respect2maperiod_2 = input.int(defval=200, title='',group=confirmation_group, inline='2ma',tooltip=ema2_tooltip)
ema3_tooltip = "Generates Long signal if first EMA (Fastest) cross above 2nd and 3rd EMA and 2nd EMA cross above 3rd EMA.\n\n Generates Short signal if first EMA (Fastest) cross below 2nd and 3rd EMA and 2nd EMA cross below 3rd EMA .\n\n Default values are 9,21 and 55. you can change that to meet your requirement."
respect3ma = input.bool (false, "3 EMA Cross : ", group=confirmation_group, inline='3ma',tooltip=ema3_tooltip)
respect3maperiod_1 = input.int(defval=9, title='',group=confirmation_group, inline='3ma',tooltip=ema3_tooltip)
respect3maperiod_2 = input.int(defval=21, title='',group=confirmation_group, inline='3ma',tooltip=ema3_tooltip)
respect3maperiod_3 = input.int(defval=55, title='',group=confirmation_group, inline='3ma',tooltip=ema3_tooltip)
respectrf = input.bool (false, "Range Filter", group=confirmation_group, inline='rf')
rftype = input.string(title="", defval="Default", options= , group=confirmation_group, inline='rf')
respectrqk = input.bool (true, "Rational Quadratic Kernel (RQK)", group=confirmation_group, inline='rqk',tooltip="Nadaraya Watson: Rational Quadratic Kernel (RQK)")
respectst = input.bool (false, "SuperTrend", group=confirmation_group, inline='st')
respectht = input.bool (false, "Half Trend", group=confirmation_group, inline='ht')
respectdonchian = input.bool (false, "Donchian Trend Ribbon", group=confirmation_group, inline='donchian')
respectroc = input.bool (false, "Rate of Change (ROC)", group=confirmation_group, inline='roc')
respecttsi = input.bool (false, "True Strength Indicator (TSI)", group=confirmation_group, inline='tsi')
tsitooltip = "Signal Crossover:\n\n TSI crossover or greater than signal line for long, and TSI crossunder signal line for short.\n\n Zero Line Cross:\n\n TSI cross above zero line and signal line for long signal. Tsi Cross below zero and signal line for short signal."
tsitype = input.string(title="", defval="Signal Cross", options= ,tooltip=tsitooltip, group=confirmation_group, inline='tsi')
respecttdfi = input.bool (false, "Trend Direction Force Index (TDFI)", group=confirmation_group, inline='tdfi')
respectmd = input.bool (false, "McGinley Dynamic", group=confirmation_group, inline='md')
respectdpo = input.bool (false, "Detrended Price Oscillator (DPO)", group=confirmation_group, inline='dpo')
respectichi = input.bool (false, "Ichimoku Cloud", group=confirmation_group, inline='ichi')
respectsuperichi = input.bool (false, "SuperIchi", group=confirmation_group, inline='ichi',tooltip="Ichimoku Cloud Conditions: \n \n 1. Candle above cloud \n \n 2. Converstion Line above base line \n \n 3. Leading 26 bar cloud is green \n \n 4. lagging span is above the cloud")
respecttrendline_breakout = input.bool (false, "Trendline Breakout", group=confirmation_group, inline='tb')
respectrd = input.bool (false, "Range Detector", group=confirmation_group, inline='rd',tooltip="Range Detector:\n\n if used as leading indicator, it will be based on range breakout. \n\n If used as confirmation indicator, it will be used to filter entries within the active range area.")
respecthacolt = input.bool (false, "Heiken-Ashi Candlestick Oscillator", group=confirmation_group, inline='hacolt',tooltip="Vervoort LongTerm Heiken-Ashi Candlestick Oscillator:\n\n If oscilliation is above 0 line, then long signal is issued and if below zero line, short signal is issued.")
respectbx = input.bool (false, "B-Xtrender", group=confirmation_group, inline='bx')
bxtype = input.string(title="", defval="Short and Long term trend", options= , group=confirmation_group, inline='bx', tooltip = "Short term trend:\n\n===================== \n\n For buy signal the short term trend line must turn green, and for the sell signal, the short term trend line must turn red. \n\n Short and Long term trend: \n\n===================== \n\n For buy signal, the short term trend must change from red to green and long term trend cross above zero line, for Sell signal the short term trend must turn red and long term trend line cross down the zero line..")
respectbbpt = input.bool (false, "Bull bear Power Trend", group=confirmation_group, inline='bbpt')
bbpttype = input.string(title="", defval="Follow Trend", options= , group=confirmation_group, inline='bbpt', tooltip = "Follow Trend:\n\n===================== \n\n Buy signal will be validated if the BBPT trend line is above 2, and Sell signal will be validated if BBPT trend line is below -2. \n\n Without Trend: \n\n===================== \n\n Ignore the BBPT trend line.")
respectvwap = input.bool (false, "VWAP", group=confirmation_group, inline='vwap')
respectbbosc = input.bool (false, "BB Oscillator", group=confirmation_group, inline='bbosc')
bbtype = input.string(title="", defval="Entering Lower/Upper Band", options= , group=confirmation_group, inline='bbosc')
respecttm = input.bool (false, "Trend Meter", group=confirmation_group, inline='tm')
tmtype = input.string(title="", defval="3 TM and 2 TB change to same color", options= , group=confirmation_group, inline='tm')
respectce = input.bool (false, "Chandelier Exit", group=confirmation_group, inline='ce')
respectcci = input.bool (false, "CCI", group=confirmation_group, inline='cci')
respectao = input.bool (false, "Awesome Oscillator", group=confirmation_group, inline='ao')
aotype = input.string(title="", defval="Zero Line Cross", options= , group=confirmation_group, inline='ao', tooltip = "Zero Line Cross:\n\n If AO value cross the zero line up, Buy signal will be generated, and if AO value cross down the zero line, sell signal will be generated.")
respectadx = input.bool (false, "DMI (ADx)", group=confirmation_group, inline='adx')
adxtype = input.string(title="", defval="Adx & +Di -Di", options= , group=confirmation_group, inline='adx', tooltip = "Adx Only:\n\n If Adx value is above the defined level. \n\n Adx & +Di -DI :\n\n When Adx value is above the defined level and croseeover between +di and -di. Di will determine the direction of the movement. \n\n Advance: ")
respectsar = input.bool (false, "Parabolic SAR (PSAR)", group=confirmation_group, inline='sar')
respectwae = input.bool (false, "Waddah Attar Explosion", group=confirmation_group, inline='wae')
vo_tooltip = "Volatility Oscillator: \n\n ======================= \n\n If the spike line is above the upper line, buy signal is generated (or validated). \n\n If the spike line is below the lower line, sell signal is generated (or validated)."
respectvo = input.bool (false, "Volatility Oscillator", group=confirmation_group, inline='vo', tooltip = vo_tooltip)
ci_tooltip = "Choppiness index: \n\n ======================= \n\n If the index is below the defined threshold (default 61.8) then asset is considered trending and signal will be validated, if index is above 61.8 then asset is considered having sideway movement."
respectci = input.bool (false, "Choppiness Index ", group=confirmation_group, inline='ci')
ci_limit = input.float(61.8,title=" ", inline='ci',group=confirmation_group, tooltip = ci_tooltip)
respectdv = input.bool (false, "Damiani Volatility (DV)", group=confirmation_group, inline='dv')
dvtype = input.string(title="", defval="Simple", options= , group=confirmation_group, inline='dv', tooltip = "Simple\n Volatility is green. \nThreshold\n Volatility green and >1.1")
stochtooltip="CrossOver:\n------------------\n\n CrossOver of K and D line at any level. \n\n CrossOver in OB & OS levels:\n\n Generate buy signal if crossover happens in oversold area and crossing up oversold level.\n\n Generate sell signal on crossover in overbought area and cross down upper level. \n------------------\n\n %K above/below %D\n------------------\n: Generate Buy signal or validate other signal if %K is above %D and opposite for Sell Signal."
respectstochastic = input.bool (false, "Stochastic", group=confirmation_group, inline='stoch')
stochtype = input.string(title="", defval="CrossOver", options= ,tooltip=stochtooltip, group=confirmation_group, inline='stoch')
rsi_tooltip = "RSI MA Cross:\n=============\n Generate buy signal when RSI cross up RSI MA line and sell signal when RSI cross down RSI MA line.\n\nRSI Exits OB/OS zones:\n==================\n Generate Buy signal when RSI crosses down the overbough zone and sell signal when RSI crosses up the oversold zone.\n\nRSI Level:\n==========\nGenerate buy signal if RSI cross above the specific level and sell signal when RSI crossdown the level.\n\n\n +++++\nYou can change the setting to define the OB/OS and MidLine Levels"
respectrsi = input.bool (false, "RSI", group=confirmation_group, inline='rsi')
rsitype = input.string(title="", defval="RSI MA Cross", options= , tooltip=rsi_tooltip, group=confirmation_group, inline='rsi')
rsima_tooltip = "RSI MA Direction:\n=============\n The buy and sell signal will respect the RSI MA direction. For buy signal, the RSI MA should be increasing or same compared to previous RSI MA. \n\n for SHORT, the RSI MA should be same or decreasing compared to last RSI MA"
respectrsima = input.bool (false, "RSI MA Direction", group=confirmation_group, inline='rsi2',tooltip=rsima_tooltip)
rsilimit_tooltip = "RSI Limit:\n=============\n This is to allow you to set limit for the RSI value for long and short. default value for long is 40, which means if the RSI is 40 or above, only then BUY signal will be validated. \n\nfor short if RSI is 60 or less, only then sell signal willbe validated."
respectrsilimit = input.bool (false, "RSI Limit : ", group=confirmation_group, inline='rsi3',tooltip=rsilimit_tooltip)
rsilimitup = input.int(40, title="Long",inline='rsi3', group=confirmation_group)
rsilimitdown = input.int(60, title="short",inline='rsi3', group=confirmation_group)
rsimalimit_tooltip = "RSI MA Limit:\n=============\n This is to allow you to set limit for the RSI MA value for long and short. default value for long is 40, which means if the RSI MA is 40 or above, only then BUY signal will be validated. \n\nfor short if RSI MA is 60 or less, only then sell signal willbe validated."
respectrsimalimit = input.bool (false, "RSI MA Limit : ", group=confirmation_group, inline='rsi4',tooltip=rsimalimit_tooltip)
rsimalimitup = input.int(40, title="Long",inline='rsi4', group=confirmation_group)
rsimalimitdown = input.int(60, title="short",inline='rsi4', group=confirmation_group)
macdtooltip="MACD Crossover:\n------------------\n\n CrossOver of MACD and the Signal line. Generates Long signal when MACD cross up Signal line and Short signal when MACD cross down Signal Line. . \n\n Zero line crossover:\n------------------\n\n Generate buy signal when MACD cross up the zero line and Sell signal when MACD cross down the zero line."
respectmacd = input.bool (false, "MACD", group=confirmation_group, inline='macd')
macdtype = input.string(title="", defval="MACD Crossover", options= ,tooltip=macdtooltip, group=confirmation_group, inline='macd')
respectssl = input.bool (false, "SSL Channel", group=confirmation_group, inline='ssl')
respectstc = input.bool (false, "Schaff Trend Cycle (STC)", group=confirmation_group, inline='stc')
respectchaikin = input.bool (false, "Chaikin Money Flow", group=confirmation_group, inline='chaikin')
respectvol = input.bool (false, "Volume", group=confirmation_group, inline='volume')
volumetype = input.string(title="", defval="volume above MA", options= , group=confirmation_group, inline='volume', tooltip = "Simple volume is comparing the up/down volme with previous candle. \nVolume delta will compare the delta or difference between up and down volume with previous candle.\nExample:\n up volume = 100 \n Down volume=-1100\n Delta = -1000\n Satisfy the bear flag condition if previous -ve delta is lower")
respectwolf = input.bool (false, "Wolfpack Id", group=confirmation_group, inline='wolf')
respectqqe = input.bool (false, "QQE Mod", group=confirmation_group, inline='qqe')
qqetype = input.string(title="", defval="Line", options= , group=confirmation_group, inline='qqe', tooltip = "Line: signal generated when QQE line is above or below 0. \nBar: when Blue bar is above 0 or Red bar below 0 \nLine & Bar: Both Bar and Line to be above(bullist) or below (beari
MA RSI MACD Signal SuiteThis Pine Script™ is designed for use in Trading View and generates trading signals based on moving average (MA) crossovers, RSI (Relative Strength Index) signals, and MACD (Moving Average Convergence Divergence) indicators. It provides visual markers on the chart and can be configured to suit various trading strategies.
1. Indicator Overview
The indicator includes signals for:
Moving Averages (MA): It tracks crossovers between different types of moving averages.
RSI: Signals based on RSI crossing certain levels or its signal line.
MACD: Buy and sell signals generated by MACD crossovers.
2. Inputs and Customization
Moving Averages (MAs):
You can customize up to 6 moving averages with different types, lengths, and colors.
MA Type: Choose from different types of moving averages:
SMA (Simple Moving Average)
EMA (Exponential Moving Average)
HMA (Hull Moving Average)
SMMA (RMA) (Smoothed Moving Average)
WMA (Weighted Moving Average)
VWMA (Volume Weighted Moving Average)
T3, DEMA, TEMA
Source: Select the price to base the MA on (e.g., close, open, high, low).
Length: Define the number of periods for each moving average.
Examples:
MA1: Exponential Moving Average (EMA) with a period of 9
MA2: Exponential Moving Average (EMA) with a period of 21
RSI Settings:
RSI is calculated based on a user-defined period and is used to identify potential overbought or oversold conditions.
RSI Length: Lookback period for RSI (default 14).
Overbought Level: Defines the overbought threshold for RSI (default 70).
Oversold Level: Defines the oversold threshold for RSI (default 30).
You can also adjust the smoothing for the RSI signal line and customize when to trigger buy and sell signals based on the RSI crossing these levels.
MACD Settings:
MACD is used for identifying changes in momentum and trends.
Fast Length: The period for the fast moving average (default 12).
Slow Length: The period for the slow moving average (default 26).
Signal Length: The period for the signal line (default 9).
Smoothing Method: Choose between SMA or EMA for both the MACD and the signal line.
3. Signal Logic
Moving Average (MA) Crossover Signals:
Crossover: A bullish signal is generated when a fast MA crosses above a slow MA.
Crossunder: A bearish signal is generated when a fast MA crosses below a slow MA.
The crossovers are plotted with distinct colors, and the chart will display markers for these crossover events.
RSI Signals:
Oversold Crossover: A bullish signal when RSI crosses over its signal line below the oversold level (30).
Overbought Crossunder: A bearish signal when RSI crosses under its signal line above the overbought level (70).
RSI signals are divided into:
Aggressive (Early) Entries: Signals when RSI is crossing the oversold/overbought levels.
Conservative Entries: Signals when RSI confirms a reversal after crossing these levels.
MACD Signals:
Buy Signal: Generated when the MACD line crosses above the signal line (bullish crossover).
Sell Signal: Generated when the MACD line crosses below the signal line (bearish crossunder).
Additionally, the MACD histogram is used to identify momentum shifts:
Rising to Falling Histogram: Alerts when the MACD histogram switches from rising to falling.
Falling to Rising Histogram: Alerts when the MACD histogram switches from falling to rising.
4. Visuals and Alerts
Plotting:
The script plots the following on the price chart:
Moving Averages (MA): The selected MAs are plotted as lines.
Buy/Sell Shapes: Triangular markers are displayed for buy and sell signals generated by RSI and MACD.
Crossover and Crossunder Markers: Crosses are shown when two MAs crossover or crossunder.
Alerts:
Alerts can be configured based on the following conditions:
RSI Signals: Alerts for oversold or overbought crossover and crossunder events.
MACD Signals: Alerts for MACD line crossovers or momentum shifts in the MACD histogram.
Alerts are triggered when specific conditions are met, such as:
RSI crosses over or under the oversold/overbought levels.
MACD crosses the signal line.
Changes in the MACD histogram.
5. Example Usage
1. Trend Reversal Setup:
Buy Signal: Use the RSI oversold crossover and MACD bullish crossover to identify potential entry points in a downtrend.
Sell Signal: Use the RSI overbought crossunder and MACD bearish crossunder to identify potential exit points or short entries in an uptrend.
2. Momentum Strategy:
Combine MACD and RSI signals to identify the strength of a trend. Use MACD histogram analysis and RSI levels for confirmation.
3. Moving Average Crossover Strategy:
Focus on specific MA crossovers, such as the 9-period EMA crossing above the 21-period EMA, for buy signals. When a longer-term MA (e.g., 50-period) crosses a shorter-term MA, it may indicate a strong trend change.
6. Alerts Conditions
The script includes several alert conditions, which can be triggered and customized based on the user’s preferences:
RSI Oversold Crossover: Alerts when RSI crosses over the signal line below the oversold level (30).
RSI Overbought Crossunder: Alerts when RSI crosses under the signal line above the overbought level (70).
MACD Buy/Sell Crossover: Alerts when the MACD line crosses the signal line for a buy or sell signal.
7. Conclusion
This script is highly customizable and can be adjusted to suit different trading strategies. By combining MAs, RSI, and MACD, traders can gain multiple perspectives on the market, enhancing their ability to identify potential buy and sell opportunities.
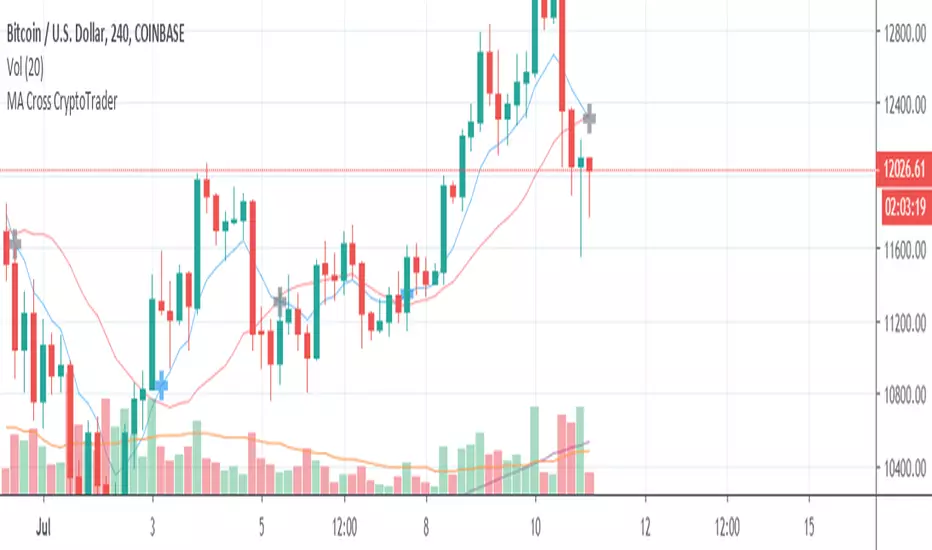
MA Dashboard (NAPC Histogram Table) MADashV1MA Dashboard (MAPC Histogram Table) MADashV1 - User Guide
1. Introduction & Purpose
The "MA Dashboard (MADashV1)" indicator is a tool for TradingView designed to give you a quick, comprehensive overview of how the current price relates to multiple Moving Averages (MAs). It displays key information in a convenient table and provides a visual histogram in a separate pane below your main price chart.
Its main goals are:
To monitor up to six different MAs simultaneously without cluttering your main chart.
To instantly see if the price is currently above or below each MA ("Status").
To show the actual value of each MA ("MA$").
To identify the price level of the most recent price crossover for each MA within a specific lookback period (" TSX:XMA ").
To quantify the exact difference between the current price and each MA ("MAPC" - Moving Average Price Crossover/Difference).
To visualize the MAPC of one selected MA as a histogram for quick momentum assessment.
To optionally plot the historical MAPC values as lines in the histogram pane.
2. Key Features
Configurable MAs: Set up to 6 independent Moving Averages. For each, you can choose:
Type (SMA, EMA, WMA, RMA)
Length (Period)
Source (Close, Open, High, Low, etc.)
Color (Used for identification in the table)
Informative Table: A dashboard summarizing all configured MAs, showing:
MA Number (1-6)
Type & Length settings
Current MA Value (MA$)
Price Status relative to MA (Bullish/Bearish/Neutral)
Last Crossover Price ( TSX:XMA ) with color-coded background (Green=Up, Red=Down)
Price Difference from MA (MAPC) with color-coded text (Green=Positive, Red=Negative)
MAPC Histogram: Plotted in a separate pane, showing the difference between the price and one user-selected MA.
Green bars indicate the price is above the selected MA.
Red bars indicate the price is below the selected MA.
The height of the bars shows the magnitude of the difference.
Optional MAPC Lines: Plot the historical MAPC values for any of the 6 MAs as lines directly on the histogram pane for comparison.
Customizable Appearance: Control the table's position, colors (background, text, header, border), border size, and text size.
Flexible Formatting: Adjust the number of decimal places displayed for price values and MAPC values.
Crossover Lookback: Define how many bars back the indicator should look for the last price crossover ( TSX:XMA ).
3. How It Works (Simplified)
MA Calculation: The indicator calculates the value of each enabled Moving Average based on your chosen settings (Type, Length, Source).
Status Check: For each MA, it compares the current price (from the MA's Source setting) to the MA's calculated value. If the price is higher, the status is "Bullish"; if lower, "Bearish"; if equal, "Neutral".
MAPC Calculation: It simply subtracts the MA's value from the current price (Price - MA Value). This gives the raw price difference, shown in the MAPC column.
TSX:XMA Calculation: It looks back over the number of bars you specified ("Crossover Lookback Bars"). It finds the most recent instance where the price crossed either above or below the MA within that lookback period. It then records the price at which that specific crossover occurred and displays it in the TSX:XMA column. The background color indicates if the last cross within the lookback was upwards (green) or downwards (red). If no cross occurred within the lookback, it shows "N/A".
Histogram: It takes the MAPC value (Price - MA Value) calculated for the single MA you selected in the "Histogram Source MA" setting and plots it as a bar for each candle.
4. Indicator Components
Histogram Pane: This appears below your main price chart.
Histogram Bars: Visual representation of the MAPC for the selected MA.
Zero Line: A horizontal line indicating where the price is exactly equal to the selected MA.
(Optional) MAPC Lines: Lines showing the historical MAPC values for any MAs you choose to plot.
Information Table: Displayed on top of the Histogram Pane (or wherever you position it). This is the main dashboard showing the data for all enabled MAs.
5. Configuration Settings (Inputs)
When you add the indicator to your chart, you'll see these settings:
General Settings:
Show Info Table: Turn the table display on or off.
Table Horizontal/Vertical Position: Choose where the table appears (Top/Middle/Bottom, Left/Center/Right).
Table BG Color, Table Text Color, Table Header Color: Customize the table's colors.
Table Border Size, Table Border Color: Adjust the table's border.
Text Size: Change the font size within the table.
Formatting:
Price Decimals: Set how many decimal places to show for MA values (MA$) and crossover prices ( TSX:XMA ). "Default" uses the chart's setting.
MAPC Decimals: Set how many decimal places to show for the MAPC column values.
Crossover Settings:
Crossover ( TSX:XMA ) Lookback Bars: How many past bars to check for the last price/MA crossover. A smaller number focuses on recent crosses.
Histogram Settings:
Show Histogram Pane: Turn the entire histogram pane (including bars and lines) on or off.
Histogram Source MA: Crucial setting! Select which MA (MA1 to MA6) will be used to generate the histogram bars.
Histogram Positive/Negative Color: Choose the colors for the histogram bars when the price is above (positive) or below (negative) the selected MA.
Plot MAPC Line 1 to Plot MAPC Line 6: Check these boxes to draw the historical MAPC value for the corresponding MA as a line on the histogram pane.
MA 1 to MA 6 Settings:
Enable MA X: Turn each specific MA on or off. If off, it won't be calculated or shown in the table.
Type: Select the calculation type (SMA, EMA, etc.).
Length: Set the period for the MA.
Source: Choose the price data used for the MA calculation (Close, Open, High, Low, hl2, etc.).
Color: Select a color for this MA. This color is used as the background for the MA number in the first column of the table for easy identification.
Style, Width: These primarily affect how the MA would look if plotted on the main chart (which this indicator doesn't do by default), but the Width setting is not used in the table or histogram pane.
6. How to Interpret the Output
Table:
MA, Type, Len: Reminders of your settings for each row.
MA$: The current calculated value of that Moving Average.
Status: Quickly see if the price is currently bullish (above) or bearish (below) relative to that specific MA. Look for confluence (multiple MAs showing the same status). Text color matches MAPC (Green=Bullish, Red=Bearish).
TSX:XMA : Shows the price level of the last crossover within your lookback period. The background color tells you the direction of that cross (Green = Price crossed UP, Red = Price crossed DOWN). Useful for identifying potential support/resistance levels based on recent crosses. "N/A" means no cross occurred within the lookback.
MAPC: Shows the exact price difference between the source price and the MA. A large positive number means the price is significantly above the MA; a large negative number means it's significantly below. The text color indicates the direction (Green = Price > MA, Red = Price < MA). Useful for gauging the strength of deviation from the MA.
Histogram:
Focus on the MA selected in Histogram Source MA.
Bars above Zero: Price is above the selected MA (Bullish). Taller bars mean a larger difference.
Bars below Zero: Price is below the selected MA (Bearish). Longer bars (downwards) mean a larger difference.
Crossing the Zero Line: Indicates the price is crossing the selected MA.
Trend/Momentum: Observe if the histogram bars are generally staying positive or negative, and if their height/length is increasing or decreasing, which can indicate strengthening or weakening momentum relative to that MA.
MAPC Lines (if enabled):
Compare the lines to each other and the zero line. See how the price difference for different MAs has evolved over time. For example, you could plot a short-term MAPC line and a long-term MAPC line to see how they diverge or converge.
7. Potential Use Cases
Trend Confirmation: Check if the price is consistently above (bullish) or below (bearish) multiple MAs according to the "Status" column.
Momentum Gauge: Use the Histogram height/depth or the MAPC values to see how far the price is deviating from key MAs. Increasing deviation might suggest strong momentum, while decreasing deviation might suggest consolidation or reversal potential.
Crossover Signals: Use the " TSX:XMA " column's background color to quickly spot recent crossovers within your defined lookback. Note the price level ( TSX:XMA value) where it happened.
Dynamic Support/Resistance: The current "MA$" values act as potential dynamic support (if price is above) or resistance (if price is below). The " TSX:XMA " price shows where recent interactions occurred.
Comparing MA Relationships: Enable MAPC lines for different MAs (e.g., a fast MA and a slow MA) to visualize how their distance from the price changes relative to each other.
8. Important Notes
This indicator plots in a separate pane (overlay=false), not directly on your price chart.
The MA lines themselves are not plotted on the main chart by default, although the plotting code exists internally. The focus is on the table and histogram data.
MAPC shows the absolute price difference, not a percentage difference.
The usefulness of the " TSX:XMA " column depends heavily on the "Crossover Lookback Bars" setting.
This guide should help you understand and effectively use the MA Dashboard (MADashV1) indicator. Remember to experiment with the settings to tailor it to your specific trading style and the assets you trade.
Easy MA SignalsEasy MA Signals
Overview
Easy MA Signals is a versatile Pine Script indicator designed to help traders visualize moving average (MA) trends, generate buy/sell signals based on crossovers or custom price levels, and enhance chart analysis with volume-based candlestick coloring. Built with flexibility in mind, it supports multiple MA types, crossover options, and customizable signal appearances, making it suitable for traders of all levels. Whether you're a day trader, swing trader, or long-term investor, this indicator provides actionable insights while keeping your charts clean and intuitive.
Configure the Settings
The indicator is divided into three input groups for ease of use:
General Settings:
Candlestick Color Scheme: Choose from 10 volume-based color schemes (e.g., Sapphire Pulse, Emerald Spark) to highlight high/low volume candles. Select “None” for TradingView’s default colors.
Moving Average Length: Set the MA period (default: 20). Adjust for faster (lower values) or slower (higher values) signals.
Moving Average Type: Choose between SMA, EMA, or WMA (default: EMA).
Show Buy/Sell Signals: Enable/disable signal plotting (default: enabled).
Moving Average Crossover: Select a crossover type (e.g., MA vs VWAP, MA vs SMA50) for signals or “None” to disable.
Volume Influence: Adjust how volume impacts candlestick colors (default: 1.2). Higher values make thresholds stricter.
Signal Appearance Settings:
Buy/Sell Signal Shape: Choose shapes like triangles, arrows, or labels for signals.
Buy/Sell Signal Position: Place signals above or below bars.
Buy/Sell Signal Color: Customize colors for better visibility (default: green for buy, red for sell).
Custom Price Alerts:
Custom Buy/Sell Alert Price: Set specific price levels for alerts (default: 0, disabled). Enter a non-zero value to enable.
Set Up Alerts
To receive notifications (e.g., sound, popup, email) when signals or custom price levels are hit:
Click the Alert button (alarm clock icon) in TradingView.
Select Easy MA Signals as the condition and choose one of the four alert types:
MA Crossover Buy Alert: Triggers on MA crossover buy signals.
MA Crossover Sell Alert: Triggers on MA crossover sell signals.
Custom Buy Alert: Triggers when price crosses above the custom buy price.
Custom Sell Alert: Triggers when price crosses below the custom sell price.
Enable Play Sound and select a sound (e.g., “Bell”).
Set the frequency (e.g., Once Per Bar Close for confirmed signals) and create the alert.
Analyze the Chart
Moving Average Line: Displays the selected MA with color changes (green for bullish, red for bearish, gray for neutral) based on price position relative to the MA.
Buy/Sell Signals: Appear as shapes or labels when crossovers or custom price levels are hit.
Candlestick Colors: If a color scheme is selected, candles change color based on volume strength (high, low, or neutral), aiding in trend confirmation.
Why Use Easy MA Signals?
Easy MA Signals is designed to simplify technical analysis while offering advanced customization. It’s ideal for traders who want:
A clear visualization of MA trends and crossovers.
Flexible signal generation based on MA crossovers or custom price levels.
Volume-enhanced candlestick coloring to identify market strength.
Easy-to-use settings with tooltips for beginners and pros alike.
This script is particularly valuable because it combines multiple features into one indicator, reducing chart clutter and providing actionable insights without overwhelming the user.
Benefits of Easy MA Signals
Highly Customizable: Supports SMA, EMA, and WMA with adjustable lengths.
Offers multiple crossover options (VWAP, SMA10, SMA20, etc.) for tailored strategies.
Custom price alerts allow precise targeting of key levels.
Volume-Based Candlestick Coloring: 10 unique color schemes highlight volume strength, helping traders confirm trends.
Adjustable volume influence ensures adaptability to different markets.
Flexible Signal Visualization: Choose from various signal shapes (triangles, arrows, labels) and positions (above/below bars).
Customizable colors improve visibility on any chart background.
Alert Integration: Built-in alert conditions for crossovers and custom prices support sound, email, and app notifications.
Easy setup for real-time trading decisions.
User-Friendly Design: Organized input groups with clear tooltips make configuration intuitive.
Suitable for beginners and advanced traders alike.
Example Use Cases
Swing Trading with MA Crossovers:
Scenario: A trader wants to trade Bitcoin (BTC/USD) on a 4-hour chart using an EMA crossover strategy.
Setup:
Set Moving Average Type to EMA, Length to 20.
Set Moving Average Crossover to “MA vs SMA50”.
Enable Show Buy/Sell Signals and choose “arrowup” for buy, “arrowdown” for sell.
Select “Emerald Spark” for candlestick colors to highlight volume surges.
Usage: Buy when the EMA20 crosses above the SMA50 (green arrow appears) and volume is high (dark green candles). Sell when the EMA20 crosses below the SMA50 (red arrow). Set alerts for real-time notifications.
Scalping with Custom Price Alerts:
Scenario: A day trader monitors Tesla (TSLA) on a 5-minute chart and wants alerts at specific support/resistance levels.
Setup:
Set Custom Buy Alert Price to 150.00 (support) and Custom Sell Alert Price to 160.00 (resistance).
Use “labelup” for buy signals and “labeldown” for sell signals.
Keep Moving Average Crossover as “None” to focus on price alerts.
Usage: Receive a sound alert and label when TSLA crosses 150.00 (buy) or 160.00 (sell). Use volume-colored candles to confirm momentum before entering trades.
When NOT to Use Easy MA Signals
High-Frequency Trading: Reason: The indicator relies on moving averages and volume, which may lag in ultra-fast markets (e.g., sub-second trades). High-frequency traders may need specialized tools with real-time tick data.
Alternative: Use order book or market depth indicators for faster execution.
Low-Volatility or Sideways Markets:
Reason: MA crossovers and custom price alerts can generate false signals in choppy, range-bound markets, leading to whipsaws.
Alternative: Use oscillators like RSI or Bollinger Bands to trade within ranges.
This indicator is tailored more towards less experienced traders. And as always, paper trade until you are comfortable with how this works if you're unfamiliar with trading! We hope you enjoy this and have great success. Thanks for your interested in Easy MA Signals!
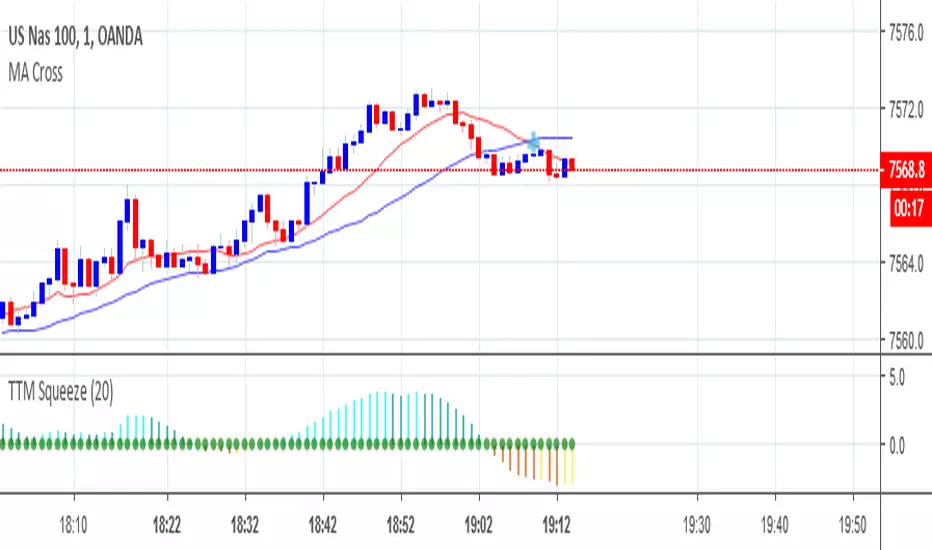
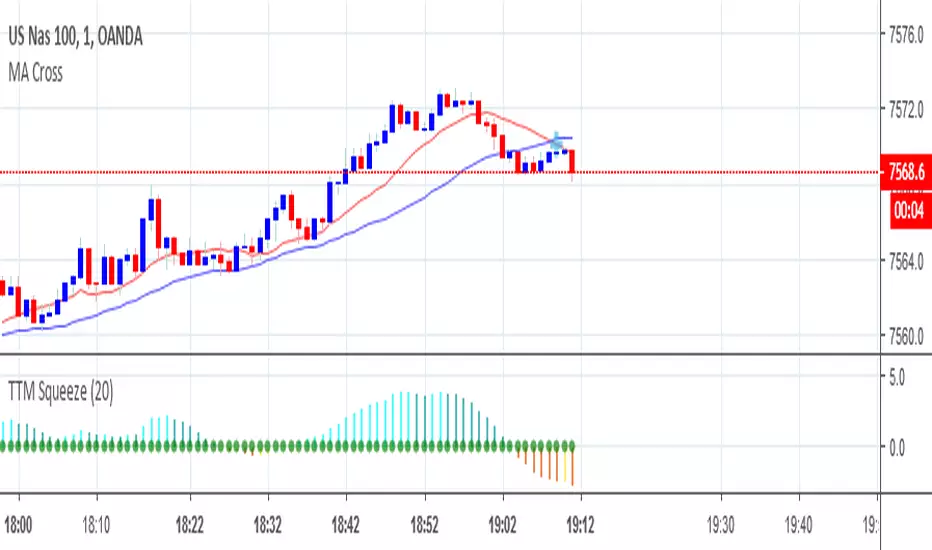
DAMA OSC - Directional Adaptive MA OscillatorOverview:
The DAMA OSC (Directional Adaptive MA Oscillator) is a highly customizable and versatile oscillator that analyzes the delta between two moving averages of your choice. It detects trend progression, regressions, rebound signals, MA cross and critical zone crossovers to provide highly contextual trading information.
Designed for trend-following, reversal timing, and volatility filtering, DAMA OSC adapts to market conditions and highlights actionable signals in real-time.
Features:
Support for 11 custom moving average types (EMA, DEMA, TEMA, ALMA, KAMA, etc.)
Customizable fast & slow MA periods and types
Histogram based on percentage delta between fast and slow MA
Trend direction coloring with “Green”, “Blue”, and “Red” zones
Rebound detection using close or shadow logic
Configurable thresholds: Overbought, Oversold, Underbought, Undersold
Optional filters: rebound validation by candle color or flat-zone filter
Full visual overlay: MA lines, crossover markers, rebound icons
Complete alert system with 16 preconfigured conditions
How It Works:
Histogram Logic:
The histogram measures the percentage difference between the fast and slow MA:
hist_value = ((FastMA - SlowMA) / SlowMA) * 100
Trend State Logic (Green / Blue / Red):
Green_Up = Bullish acceleration
Blue_Up (or Red_Up, depending the display settings) = Bullish deceleration
Blue_Down (or Green_Down, depending the display settings) = Bearish deceleration
Red_Down = Bearish acceleration
Rebound Logic:
A rebound is detected when price:
Crosses back over a selected MA (fast or slow)
After being away for X candles (rebound_backstep)
Optional: filtered by histogram zones or candle color
Inputs:
Display Options:
Show/hide MA lines
Show/hide MA crosses
Show/hide price rebounds
Enable/disable blue deceleration zones
DAMA Settings:
Fast/Slow MA type and length
Source input (close by default)
Overbought/Oversold levels
Underbought/Undersold levels
Rebound Settings:
Use Close and/or Shadow
Rebound MA (Fast/Slow)
Candle color validation
Flat zone filter rebounds (between UnderSold and UnderBought)
Available MA type:
SMA (Simple MA)
EMA (Exponential MA)
DEMA (Double EMA)
TEMA (Triple EMA)
WMA (Weighted MA)
HMA (Hull MA)
VWMA (Volume Weighted MA)
Kijun (Ichimoku Baseline)
ALMA (Arnaud Legoux MA)
KAMA (Kaufman Adaptive MA)
HULLMOD (Modified Hull MA, Same as HMA, tweaked for Pine v6 constraints)
Notes:
**DEMA/TEMA** reduce lag compared to EMA, useful for faster reaction in trending markets.
**KAMA/ALMA** are better suited to noisy or volatile environments (e.g., BTC).
**VWMA** reacts strongly to volume spikes.
**HMA/HULLMOD** are great for visual clarity in fast moves.
Alerts Included (Fully Configurable):
Golden Cross:
Fast MA crosses above Slow MA
Death Cross:
Fast MA crosses below Slow MA
Bullish Rebound:
Rebound from below MA in uptrend
Bearish Rebound:
Rebound from above MA in downtrend
Bull Progression:
Transition into Green_Up with positive delta
Bear Progression:
Transition into Red_Down with negative delta
Bull Regression:
Exit from Red_Down into Blue/Green with negative delta
Bear Regression:
Exit from Green_Up into Blue/Red with positive delta
Crossover Overbought:
Histogram crosses above Overbought
Crossunder Overbought:
Histogram crosses below Overbought
Crossover Oversold:
Histogram crosses above Oversold
Crossunder Oversold:
Histogram crosses below Oversold
Crossover Underbought:
Histogram crosses above Underbought
Crossunder Underbought:
Histogram crosses below Underbought
Crossover Undersold:
Histogram crosses above Undersold
Crossunder Undersold:
Histogram crosses below Undersold
Credits:
Created by Eff_Hash. This code is shared with the TradingView community and full free. do not hesitate to share your best settings and usage.
Advanced Trend and Volatility Indicator with Alerts by ZaimonThis script presents a comprehensive analytical tool that integrates multiple technical indicators to provide a holistic view of market trends and volatility. By uniquely combining Moving Averages (MA), Relative Strength Index (RSI), Stochastic Oscillator, Bollinger Bands, and Average True Range (ATR), it offers nuanced insights into price movements and helps identify potential trading opportunities.
---
### **Key Features and Integration:**
1. **Moving Averages (MA20 & MA50):**
- **Trend Identification:**
- **Methodology:** Calculates two Simple Moving Averages—MA20 (short-term) and MA50 (long-term).
- **Bullish Trend:** When MA20 crosses above MA50, indicating upward momentum.
- **Bearish Trend:** When MA20 crosses below MA50, signaling downward momentum.
- **Golden Cross & Death Cross Alerts:**
- **Golden Cross:** MA20 crossing above MA50 generates a bullish alert and visual symbol.
- **Death Cross:** MA20 crossing below MA50 triggers a bearish alert and visual symbol.
- **Integration:**
- Serves as the foundational trend indicator, influencing interpretations of other indicators within the script.
2. **Relative Strength Index (RSI):**
- **Momentum Measurement:**
- **Methodology:** Calculates RSI to assess the speed and change of price movements over a 14-period length.
- **Overbought/Oversold Conditions:** Customizable thresholds set at 70 (overbought) and 30 (oversold).
- **Alerts:**
- Generates alerts when RSI crosses above or below the specified thresholds.
- **Integration:**
- Confirms trend strength identified by MAs.
- Overbought/Oversold signals can precede potential trend reversals, especially when aligned with MA crossovers.
3. **Stochastic Oscillator:**
- **Momentum and Reversal Signals:**
- **Methodology:** Uses %K and %D lines to evaluate price momentum relative to high-low range over recent periods.
- **Bullish Signal:** %K crossing above %D in oversold territory (below 20).
- **Bearish Signal:** %K crossing below %D in overbought territory (above 80).
- **Alerts:**
- Provides alerts on bullish and bearish crossovers in extreme regions.
- **Integration:**
- Enhances RSI signals by providing additional momentum confirmation.
- When both RSI and Stochastic indicate overbought/oversold conditions, it strengthens the likelihood of a reversal.
4. **Bollinger Bands:**
- **Volatility Visualization:**
- **Methodology:** Plots upper and lower bands based on standard deviations from a moving average (BB Basis).
- **Dynamic Support/Resistance:** Prices touching or exceeding the bands may indicate potential reversals.
- **Integration:**
- Works with RSI and Stochastic to identify overextended price movements.
- Helps in assessing volatility alongside trend and momentum indicators.
5. **Average True Range (ATR):**
- **Volatility Assessment:**
- **Methodology:** Calculates ATR over a 14-period length to measure market volatility.
- **ATR Bands:** Plots upper and lower bands relative to the current price using an ATR multiplier.
- **Integration:**
- Assists in setting stop-loss and take-profit levels based on current volatility.
- Complements Bollinger Bands for a comprehensive volatility analysis.
6. **Information Table:**
- **Real-Time Data Display:**
- Shows current values of MA20, MA50, RSI, Stochastic %K and %D, BB Basis, ATR, and Trend Status.
- **Trend Status Indicator:**
- Displays "Bullish," "Bearish," or "Sideways" based on MA conditions.
- **Integration:**
- Provides a consolidated view for quick decision-making without analyzing individual indicators separately.
7. **Periodic Labels:**
- **Enhanced Visibility:**
- Adds labels every 50 bars showing RSI and Stochastic values.
- **Integration:**
- Helps track momentum changes over time and spot longer-term patterns.
---
### **How the Components Work Together:**
- **Synergistic Analysis:**
- **Trend Confirmation:** MA crossovers establish the primary trend, while RSI and Stochastic confirm momentum within that trend.
- **Volatility Context:** Bollinger Bands and ATR provide context on market volatility, refining entry and exit points suggested by trend and momentum indicators.
- **Signal Strength:** Concurrent signals from multiple indicators increase confidence in trading decisions.
---
### **Usage Guidelines:**
1. **Trend Analysis:**
- **Identify Trend Direction:**
- Observe MA20 and MA50 crossovers.
- Refer to the Trend Status in the information table.
- **Confirm with Momentum Indicators:**
- Ensure RSI and Stochastic support the identified trend.
2. **Entry and Exit Points:**
- **Overbought/Oversold Conditions:**
- Look for RSI and Stochastic reaching extreme levels.
- Consider entering positions when oversold in a bullish trend or overbought in a bearish trend.
- **Bollinger Band Interactions:**
- Use price interactions with Bollinger Bands to identify potential reversal zones.
3. **Risk Management:**
- **ATR-Based Levels:**
- Set stop-loss and take-profit levels using ATR bands to account for current volatility.
- **Adjusting to Volatility:**
- Modify position sizes and targets based on Bollinger Band width and ATR values.
4. **Alerts Setup:**
- **Customize Alert Thresholds:**
- Configure alerts for MA crossovers, RSI levels, and Stochastic crossovers according to your trading strategy.
- **Stay Informed:**
- Use alerts to monitor key events without constant chart observation.
---
### **Customization:**
- **Flexible Parameters:**
- All indicator lengths, thresholds, and settings are adjustable to suit different trading styles and timeframes.
- **Adjustable Visuals:**
- Modify plot colors, line styles, and label positions to enhance chart readability.
---
### **Originality and Value Addition:**
This script differentiates itself by:
- **Integrated Approach:**
- Seamlessly combining multiple indicators to provide a more comprehensive analysis than using each indicator separately.
- **Enhanced Visualization:**
- Utilizing plots, fills, labels, and an information table to present data intuitively.
- **User-Friendly Features:**
- Pre-configured alerts and real-time data displays reduce the need for manual monitoring.
By explaining how each component interacts and contributes to the overall analysis, the script adds substantial value to traders seeking a multi-faceted tool for market analysis.
---
### **Additional Notes:**
- **Learning Resource:**
- The script is well-commented, serving as an educational tool for those learning Pine Script and technical analysis integration.
- **Further Enhancements:**
- Opportunities exist to incorporate additional indicators like MACD or ADX, and to develop advanced alert logic, such as RSI or Stochastic divergences.
---
### **Disclaimer:**
- **Educational Purpose Only:**
- This script is provided for informational purposes and should not be construed as financial advice.
- **Risk Acknowledgment:**
- Trading involves significant risk; past performance is not indicative of future results.
- **Due Diligence:**
- Users should conduct their own analysis and consider consulting a financial professional before making trading decisions.
---
By providing detailed explanations of the methodologies and the synergistic use of multiple indicators, this script aligns with TradingView's guidelines for originality and usefulness. It offers traders a unique tool that enhances market analysis through the thoughtful integration of technical indicators.
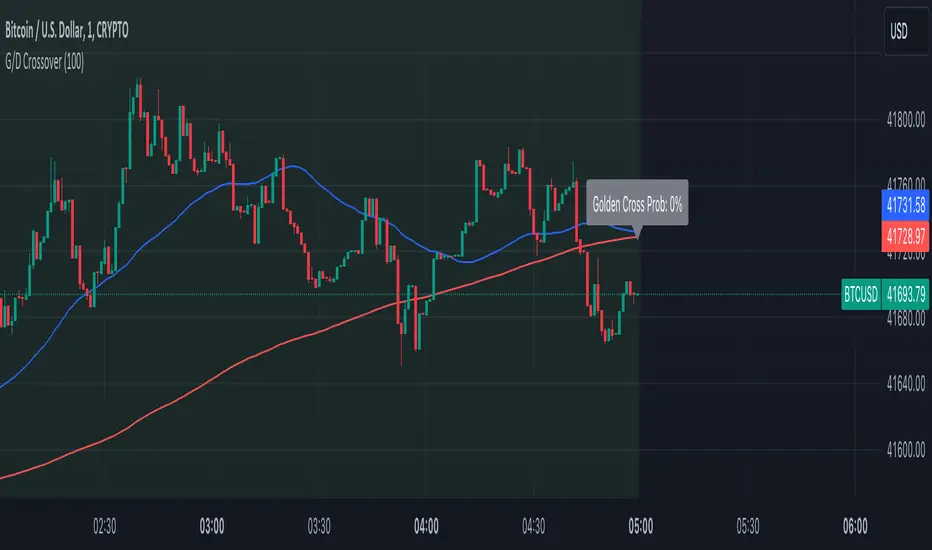
Golden Cross and Death Cross with ProbabilityThe Advanced Golden and Death Crossover Indicator offers traders a powerful tool for identifying potential buy and sell signals through the classic technical analysis method of moving average crossovers. This script enhances decision-making by dynamically changing the chart background color in response to Golden (bullish) and Death (bearish) crossovers, providing a visual representation of the market's momentum.
Features:
Golden and Death Crossover Detection: Utilizes a 50-period SMA and a 200-period SMA to identify potential buy (golden cross) and sell (death cross) points.
Continuous Background Coloring: Changes the chart's background color to green for golden crosses and red for death crosses, offering an intuitive grasp of market trends.
Customizable Lookback Period: Allows users to adjust the lookback period for calculating the success rate of each crossover, making the indicator adaptable to various trading strategies.
Success Rate Calculation: Provides an additional layer of analysis by calculating the historical success rate of crossovers within the specified lookback period.
Instructions:
Adding the Indicator: Search for "Advanced Golden and Death Crossover Indicator" in the TradingView Indicators & Strategies library and add it to your chart.
Customization: Access the indicator settings to adjust the lookback period according to your trading preferences.
Interpretation: Use the continuous background color as a guide to market conditions, with green indicating bullish momentum and red indicating bearish momentum. The success rate of past crossovers can help assess the reliability of the signals.
How the Script Works:
The Advanced Golden and Death Crossover Indicator operates by continuously monitoring two key moving averages (MAs) on your chart: a short-term (50-period) SMA and a long-term (200-period) SMA. Here's a step-by-step breakdown of its functionality:
Crossover Detection:
Golden Cross: When the short-term MA crosses above the long-term MA, indicating potential bullish momentum, the script identifies this as a Golden Cross signal.
Death Cross: Conversely, when the short-term MA crosses below the long-term MA, suggesting potential bearish momentum, the script flags this as a Death Cross signal.
Background Coloring:
Upon detecting a Golden Cross, the script changes the chart background to green, visually representing a bullish market condition.
Upon detecting a Death Cross, the chart background turns red, indicating bearish market conditions.
This color change remains in effect until the next crossover event, providing a continuous visual cue of the market's trend direction.
Success Rate Calculation:
The script calculates the historical success rate of these crossovers within a user-defined lookback period. This metric helps assess the reliability of the signals based on past performance.
Customization:
Users have the flexibility to adjust the lookback period for the success rate calculation, allowing for customization according to individual trading strategies and risk preferences.
Application in Trading Analysis:
Traders can use this indicator as part of their technical analysis toolkit to make informed decisions about entry and exit points. The visual cues from the continuous background coloring, combined with the success rate of past signals, provide a comprehensive overview of market trends and crossover reliability. It’s important for traders to combine this indicator with other analysis tools and consider broader market conditions to optimize their trading strategy.
Disclaimer:
This script is provided for educational and informational purposes only and should not be construed as investment advice. Trading involves risk, and you should conduct your own research or consult a financial advisor before making investment decisions. The author or distributor of this script bears no responsibility for any trading losses incurred by users.
RSI Full Forecast [Titans_Invest]RSI Full Forecast
Get ready to experience the ultimate evolution of RSI-based indicators – the RSI Full Forecast, a boosted and even smarter version of the already powerful: RSI Forecast
Now featuring over 40 additional entry conditions (forecasts), this indicator redefines the way you view the market.
AI-Powered RSI Forecasting:
Using advanced linear regression with the least squares method – a solid foundation for machine learning - the RSI Full Forecast enables you to predict future RSI behavior with impressive accuracy.
But that’s not all: this new version also lets you monitor future crossovers between the RSI and the MA RSI, delivering early and strategic signals that go far beyond traditional analysis.
You’ll be able to monitor future crossovers up to 20 bars ahead, giving you an even broader and more precise view of market movements.
See the Future, Now:
• Track upcoming RSI & RSI MA crossovers in advance.
• Identify potential reversal zones before price reacts.
• Uncover statistical behavior patterns that would normally go unnoticed.
40+ Intelligent Conditions:
The new layer of conditions is designed to detect multiple high-probability scenarios based on historical patterns and predictive modeling. Each additional forecast is a window into the price's future, powered by robust mathematics and advanced algorithmic logic.
Full Customization:
All parameters can be tailored to fit your strategy – from smoothing periods to prediction sensitivity. You have complete control to turn raw data into smart decisions.
Innovative, Accurate, Unique:
This isn’t just an upgrade. It’s a quantum leap in technical analysis.
RSI Full Forecast is the first of its kind: an indicator that blends statistical analysis, machine learning, and visual design to create a true real-time predictive system.
⯁ SCIENTIFIC BASIS LINEAR REGRESSION
Linear Regression is a fundamental method of statistics and machine learning, used to model the relationship between a dependent variable y and one or more independent variables 𝑥.
The general formula for a simple linear regression is given by:
y = β₀ + β₁x + ε
β₁ = Σ((xᵢ - x̄)(yᵢ - ȳ)) / Σ((xᵢ - x̄)²)
β₀ = ȳ - β₁x̄
Where:
y = is the predicted variable (e.g. future value of RSI)
x = is the explanatory variable (e.g. time or bar index)
β0 = is the intercept (value of 𝑦 when 𝑥 = 0)
𝛽1 = is the slope of the line (rate of change)
ε = is the random error term
The goal is to estimate the coefficients 𝛽0 and 𝛽1 so as to minimize the sum of the squared errors — the so-called Random Error Method Least Squares.
⯁ LEAST SQUARES ESTIMATION
To minimize the error between predicted and observed values, we use the following formulas:
β₁ = /
β₀ = ȳ - β₁x̄
Where:
∑ = sum
x̄ = mean of x
ȳ = mean of y
x_i, y_i = individual values of the variables.
Where:
x_i and y_i are the means of the independent and dependent variables, respectively.
i ranges from 1 to n, the number of observations.
These equations guarantee the best linear unbiased estimator, according to the Gauss-Markov theorem, assuming homoscedasticity and linearity.
⯁ LINEAR REGRESSION IN MACHINE LEARNING
Linear regression is one of the cornerstones of supervised learning. Its simplicity and ability to generate accurate quantitative predictions make it essential in AI systems, predictive algorithms, time series analysis, and automated trading strategies.
By applying this model to the RSI, you are literally putting artificial intelligence at the heart of a classic indicator, bringing a new dimension to technical analysis.
⯁ VISUAL INTERPRETATION
Imagine an RSI time series like this:
Time →
RSI →
The regression line will smooth these values and extend them n periods into the future, creating a predicted trajectory based on the historical moment. This line becomes the predicted RSI, which can be crossed with the actual RSI to generate more intelligent signals.
⯁ SUMMARY OF SCIENTIFIC CONCEPTS USED
Linear Regression Models the relationship between variables using a straight line.
Least Squares Minimizes the sum of squared errors between prediction and reality.
Time Series Forecasting Estimates future values based on historical data.
Supervised Learning Trains models to predict outputs from known inputs.
Statistical Smoothing Reduces noise and reveals underlying trends.
⯁ WHY THIS INDICATOR IS REVOLUTIONARY
Scientifically-based: Based on statistical theory and mathematical inference.
Unprecedented: First public RSI with least squares predictive modeling.
Intelligent: Built with machine learning logic.
Practical: Generates forward-thinking signals.
Customizable: Flexible for any trading strategy.
⯁ CONCLUSION
By combining RSI with linear regression, this indicator allows a trader to predict market momentum, not just follow it.
RSI Full Forecast is not just an indicator — it is a scientific breakthrough in technical analysis technology.
⯁ Example of simple linear regression, which has one independent variable:
⯁ In linear regression, observations ( red ) are considered to be the result of random deviations ( green ) from an underlying relationship ( blue ) between a dependent variable ( y ) and an independent variable ( x ).
⯁ Visualizing heteroscedasticity in a scatterplot against 100 random fitted values using Matlab:
⯁ The data sets in the Anscombe's quartet are designed to have approximately the same linear regression line (as well as nearly identical means, standard deviations, and correlations) but are graphically very different. This illustrates the pitfalls of relying solely on a fitted model to understand the relationship between variables.
⯁ The result of fitting a set of data points with a quadratic function:
_________________________________________________
🔮 Linear Regression: PineScript Technical Parameters 🔮
_________________________________________________
Forecast Types:
• Flat: Assumes prices will remain the same.
• Linreg: Makes a 'Linear Regression' forecast for n periods.
Technical Information:
ta.linreg (built-in function)
Linear regression curve. A line that best fits the specified prices over a user-defined time period. It is calculated using the least squares method. The result of this function is calculated using the formula: linreg = intercept + slope * (length - 1 - offset), where intercept and slope are the values calculated using the least squares method on the source series.
Syntax:
• Function: ta.linreg()
Parameters:
• source: Source price series.
• length: Number of bars (period).
• offset: Offset.
• return: Linear regression curve.
This function has been cleverly applied to the RSI, making it capable of projecting future values based on past statistical trends.
______________________________________________________
______________________________________________________
⯁ WHAT IS THE RSI❓
The Relative Strength Index (RSI) is a technical analysis indicator developed by J. Welles Wilder. It measures the magnitude of recent price movements to evaluate overbought or oversold conditions in a market. The RSI is an oscillator that ranges from 0 to 100 and is commonly used to identify potential reversal points, as well as the strength of a trend.
⯁ HOW TO USE THE RSI❓
The RSI is calculated based on average gains and losses over a specified period (usually 14 periods). It is plotted on a scale from 0 to 100 and includes three main zones:
• Overbought: When the RSI is above 70, indicating that the asset may be overbought.
• Oversold: When the RSI is below 30, indicating that the asset may be oversold.
• Neutral Zone: Between 30 and 70, where there is no clear signal of overbought or oversold conditions.
______________________________________________________
______________________________________________________
⯁ ENTRY CONDITIONS
The conditions below are fully flexible and allow for complete customization of the signal.
______________________________________________________
______________________________________________________
🔹 CONDITIONS TO BUY 📈
______________________________________________________
• Signal Validity: The signal will remain valid for X bars .
• Signal Sequence: Configurable as AND or OR .
📈 RSI Conditions:
🔹 RSI > Upper
🔹 RSI < Upper
🔹 RSI > Lower
🔹 RSI < Lower
🔹 RSI > Middle
🔹 RSI < Middle
🔹 RSI > MA
🔹 RSI < MA
📈 MA Conditions:
🔹 MA > Upper
🔹 MA < Upper
🔹 MA > Lower
🔹 MA < Lower
📈 Crossovers:
🔹 RSI (Crossover) Upper
🔹 RSI (Crossunder) Upper
🔹 RSI (Crossover) Lower
🔹 RSI (Crossunder) Lower
🔹 RSI (Crossover) Middle
🔹 RSI (Crossunder) Middle
🔹 RSI (Crossover) MA
🔹 RSI (Crossunder) MA
🔹 MA (Crossover) Upper
🔹 MA (Crossunder) Upper
🔹 MA (Crossover) Lower
🔹 MA (Crossunder) Lower
📈 RSI Divergences:
🔹 RSI Divergence Bull
🔹 RSI Divergence Bear
📈 RSI Forecast:
🔹 RSI (Crossover) MA Forecast
🔹 RSI (Crossunder) MA Forecast
🔹 RSI Forecast 1 > MA Forecast 1
🔹 RSI Forecast 1 < MA Forecast 1
🔹 RSI Forecast 2 > MA Forecast 2
🔹 RSI Forecast 2 < MA Forecast 2
🔹 RSI Forecast 3 > MA Forecast 3
🔹 RSI Forecast 3 < MA Forecast 3
🔹 RSI Forecast 4 > MA Forecast 4
🔹 RSI Forecast 4 < MA Forecast 4
🔹 RSI Forecast 5 > MA Forecast 5
🔹 RSI Forecast 5 < MA Forecast 5
🔹 RSI Forecast 6 > MA Forecast 6
🔹 RSI Forecast 6 < MA Forecast 6
🔹 RSI Forecast 7 > MA Forecast 7
🔹 RSI Forecast 7 < MA Forecast 7
🔹 RSI Forecast 8 > MA Forecast 8
🔹 RSI Forecast 8 < MA Forecast 8
🔹 RSI Forecast 9 > MA Forecast 9
🔹 RSI Forecast 9 < MA Forecast 9
🔹 RSI Forecast 10 > MA Forecast 10
🔹 RSI Forecast 10 < MA Forecast 10
🔹 RSI Forecast 11 > MA Forecast 11
🔹 RSI Forecast 11 < MA Forecast 11
🔹 RSI Forecast 12 > MA Forecast 12
🔹 RSI Forecast 12 < MA Forecast 12
🔹 RSI Forecast 13 > MA Forecast 13
🔹 RSI Forecast 13 < MA Forecast 13
🔹 RSI Forecast 14 > MA Forecast 14
🔹 RSI Forecast 14 < MA Forecast 14
🔹 RSI Forecast 15 > MA Forecast 15
🔹 RSI Forecast 15 < MA Forecast 15
🔹 RSI Forecast 16 > MA Forecast 16
🔹 RSI Forecast 16 < MA Forecast 16
🔹 RSI Forecast 17 > MA Forecast 17
🔹 RSI Forecast 17 < MA Forecast 17
🔹 RSI Forecast 18 > MA Forecast 18
🔹 RSI Forecast 18 < MA Forecast 18
🔹 RSI Forecast 19 > MA Forecast 19
🔹 RSI Forecast 19 < MA Forecast 19
🔹 RSI Forecast 20 > MA Forecast 20
🔹 RSI Forecast 20 < MA Forecast 20
______________________________________________________
______________________________________________________
🔸 CONDITIONS TO SELL 📉
______________________________________________________
• Signal Validity: The signal will remain valid for X bars .
• Signal Sequence: Configurable as AND or OR .
📉 RSI Conditions:
🔸 RSI > Upper
🔸 RSI < Upper
🔸 RSI > Lower
🔸 RSI < Lower
🔸 RSI > Middle
🔸 RSI < Middle
🔸 RSI > MA
🔸 RSI < MA
📉 MA Conditions:
🔸 MA > Upper
🔸 MA < Upper
🔸 MA > Lower
🔸 MA < Lower
📉 Crossovers:
🔸 RSI (Crossover) Upper
🔸 RSI (Crossunder) Upper
🔸 RSI (Crossover) Lower
🔸 RSI (Crossunder) Lower
🔸 RSI (Crossover) Middle
🔸 RSI (Crossunder) Middle
🔸 RSI (Crossover) MA
🔸 RSI (Crossunder) MA
🔸 MA (Crossover) Upper
🔸 MA (Crossunder) Upper
🔸 MA (Crossover) Lower
🔸 MA (Crossunder) Lower
📉 RSI Divergences:
🔸 RSI Divergence Bull
🔸 RSI Divergence Bear
📉 RSI Forecast:
🔸 RSI (Crossover) MA Forecast
🔸 RSI (Crossunder) MA Forecast
🔸 RSI Forecast 1 > MA Forecast 1
🔸 RSI Forecast 1 < MA Forecast 1
🔸 RSI Forecast 2 > MA Forecast 2
🔸 RSI Forecast 2 < MA Forecast 2
🔸 RSI Forecast 3 > MA Forecast 3
🔸 RSI Forecast 3 < MA Forecast 3
🔸 RSI Forecast 4 > MA Forecast 4
🔸 RSI Forecast 4 < MA Forecast 4
🔸 RSI Forecast 5 > MA Forecast 5
🔸 RSI Forecast 5 < MA Forecast 5
🔸 RSI Forecast 6 > MA Forecast 6
🔸 RSI Forecast 6 < MA Forecast 6
🔸 RSI Forecast 7 > MA Forecast 7
🔸 RSI Forecast 7 < MA Forecast 7
🔸 RSI Forecast 8 > MA Forecast 8
🔸 RSI Forecast 8 < MA Forecast 8
🔸 RSI Forecast 9 > MA Forecast 9
🔸 RSI Forecast 9 < MA Forecast 9
🔸 RSI Forecast 10 > MA Forecast 10
🔸 RSI Forecast 10 < MA Forecast 10
🔸 RSI Forecast 11 > MA Forecast 11
🔸 RSI Forecast 11 < MA Forecast 11
🔸 RSI Forecast 12 > MA Forecast 12
🔸 RSI Forecast 12 < MA Forecast 12
🔸 RSI Forecast 13 > MA Forecast 13
🔸 RSI Forecast 13 < MA Forecast 13
🔸 RSI Forecast 14 > MA Forecast 14
🔸 RSI Forecast 14 < MA Forecast 14
🔸 RSI Forecast 15 > MA Forecast 15
🔸 RSI Forecast 15 < MA Forecast 15
🔸 RSI Forecast 16 > MA Forecast 16
🔸 RSI Forecast 16 < MA Forecast 16
🔸 RSI Forecast 17 > MA Forecast 17
🔸 RSI Forecast 17 < MA Forecast 17
🔸 RSI Forecast 18 > MA Forecast 18
🔸 RSI Forecast 18 < MA Forecast 18
🔸 RSI Forecast 19 > MA Forecast 19
🔸 RSI Forecast 19 < MA Forecast 19
🔸 RSI Forecast 20 > MA Forecast 20
🔸 RSI Forecast 20 < MA Forecast 20
______________________________________________________
______________________________________________________
🤖 AUTOMATION 🤖
• You can automate the BUY and SELL signals of this indicator.
______________________________________________________
______________________________________________________
⯁ UNIQUE FEATURES
______________________________________________________
Linear Regression: (Forecast)
Signal Validity: The signal will remain valid for X bars
Signal Sequence: Configurable as AND/OR
Condition Table: BUY/SELL
Condition Labels: BUY/SELL
Plot Labels in the Graph Above: BUY/SELL
Automate and Monitor Signals/Alerts: BUY/SELL
Linear Regression (Forecast)
Signal Validity: The signal will remain valid for X bars
Signal Sequence: Configurable as AND/OR
Condition Table: BUY/SELL
Condition Labels: BUY/SELL
Plot Labels in the Graph Above: BUY/SELL
Automate and Monitor Signals/Alerts: BUY/SELL
______________________________________________________
📜 SCRIPT : RSI Full Forecast
🎴 Art by : @Titans_Invest & @DiFlip
👨💻 Dev by : @Titans_Invest & @DiFlip
🎑 Titans Invest — The Wizards Without Gloves 🧤
✨ Enjoy!
______________________________________________________
o Mission 🗺
• Inspire Traders to manifest Magic in the Market.
o Vision 𐓏
• To elevate collective Energy 𐓷𐓏
Black Moving AveragesGENERAL OVERVIEW
The moving average (MA) indicator is a foundational yet versatile tool in technical analysis, used by traders and investors to smooth out price data over a specific time frame. This helps to identify the direction of a trend by filtering out short-term fluctuations or "noise" in the price action. By observing the moving average line, traders can gain insights into potential support and resistance levels, trend strength, and possible trend reversals. Moving averages are especially useful in trending markets, where they can enhance the timing of entries and exits.
The Black Moving Averages indicator is an enhanced Moving Average indicator with unique features in one indicator, features like multi-timeframe, multi-types/length, custom labelling and moving average compact PANEL with multi-symbol support.
📌HOW DOES IT WORK
A moving average is a constantly updated average price calculated by adding up the closing prices of a security over a set period and dividing by the total number of periods.
Uptrend: If the moving average line is sloping upwards and the price is above the moving average, this typically indicates an uptrend.
Downtrend: If the moving average slopes downward with price action mostly below it, a downtrend is likely in effect.
Flat/Sideways Trend: When the moving average is flat, it suggests a range-bound or consolidating market with no clear trend.
Common Moving Average Periods:
The choice of period for a moving average can vary significantly depending on the trader’s strategy:
Short-Term Traders: Often use periods such as 5, 10, or 20 (intraday or daily) to capture quick price movements.
Medium-Term Traders: Typically use 50-period MAs, which can help spot trend changes within a few weeks to a few months.
Long-Term Traders/Investors: Favor 100, 200, or even 250-period MAs to analyze the overarching trend in daily or weekly charts.
📌HOW TO USE IT
When an asset's price crosses above its moving average, it can be a signal to buy, while crossing below can be a signal to sell.
Moving Average Crossovers: When a short-term moving average crosses above a long-term moving average, it generates a “Golden Cross,” indicating a bullish trend. Conversely, when a short-term MA crosses below a long-term MA, this creates a “Death Cross,” signalling a potential bearish trend.
Moving Average Envelopes and Bands: Some traders use moving averages to create envelopes or bands (e.g., Bollinger Bands), which add upper and lower bands around the moving average. These can help to assess the volatility and gauge potential price reversals.
Dynamic Support and Resistance: Longer-term MAs, such as the 200-day SMA, often act as dynamic support or resistance. If the price bounces off this MA several times, it reinforces the indicator’s significance.
Trend Confirmation and Continuation: Traders can confirm trends by observing if the price consistently stays above or below the moving average. This can be a signal to maintain an existing position.
Crossover Signals for Entries and Exits: A crossover strategy, where a shorter MA crosses above or below a longer MA, can serve as a reliable entry or exit point. This is particularly popular for catching early trend changes.
Combining with Other Indicators: Moving averages often yield better results when used alongside other indicators, such as the Relative Strength Index (RSI) for confirming overbought or oversold conditions, or the MACD for gauging momentum.
Limitations of Moving Averages
Lagging Nature: Moving averages rely on historical data, which makes them inherently lagging indicators, meaning they tend to react after a trend is already underway.
False Signals: In range-bound or choppy markets, moving averages can produce false signals, leading to potentially unprofitable trades.
When to be cautious:
When an asset's price is driven by strong momentum, it can remain over-extended for a long time. In this case, slight pauses may be mistaken for reversals.
By refining your understanding of moving averages and using them within the broader context of technical analysis, you can leverage their simplicity and effectiveness to better time entries, and exits, and spot potential reversals in various types of market conditions.
Black Moving Averages Indicator Features:
Multiple Moving Averages with multiple types, lengths & Cross
Multi Timeframe support
Moving Average PANEL with TF, Multi Symbol, Type, Length & Trend Strength
Moving Averages Horizontal Display with Labels (Type, TF, Price)
⚙️Black Moving Average SETTINGS
+ Black Moving Averages Dashboard ◢
- Moving Averages: Enable/Disable the Moving Averages on Chart
- MA Cross: Enable/Disable the Moving Averages Cross plot on the Chart
- MA PANEL: Enable/Disable the Moving Averages Panel on Chart
- VWAP: Enable/Disable the VWAP on Chart
+ Moving Averages Display Settings ◢
- Switch to Horizontal Lines: It switches the moving averages lines into horizontal lines on the charts
- Labels: It allows users to display moving averages labels (TF, type, length), prices or both on the chart
- Label Text Size: The user can select label text size (Tiny, Small, Normal, Large, Huge)
- Label Offset: Input label offset value (distance of label display from moving averages)
+ Moving Average Settings ◢
- Moving Average Length: input value of moving average length
- Color: Color selection for moving average
- Timeframe: Selection of timeframe for the moving average
- Type: Selection of MA type for the moving average
- Source: Selection of MA source(close, open etc) for the moving average
- Style: Display style (Line, Cross, Circle) for the moving average
- Line width: Display width of the moving average
+ Moving Average Cross Settings ◢
- | | Coss A | :
Plots cross of two user-specified moving averages on the chart
- | | Coss B | :
Plots cross of two user-specified moving averages on the chart
- | | Coss C | :
Plots cross of two user-specified moving averages on the chart
+ Moving Average PANEL Settings ◢
- Override Panel Symbol: Enables user to select the symbol for MA PANEL
- MA Panel Symbol: Displays symbol on the MA PANEL
- Panel H/V Position: Displays MA Panel Horizontally or Vertically
- Moving Average Panel Position: Selection of MA Panel position on the chart
- Panel Text Size: The user can select panel text size (Tiny, Small, Normal, Large, Huge)
- Panel Text Color: Color selection for panel text
- Cross A: Displays moving averages bullish/bearish cross on the panel from "Moving Average Cross Settings"
- Cross B: Displays moving averages bullish/bearish cross on the panel from "Moving Average Cross Settings"
- Cross C: Displays moving averages bullish/bearish cross on the panel from "Moving Average Cross Settings"
- Panel MA Length: input value of panel moving average length
- Timeframe: Selection of timeframe for the panel moving average
- Type: Selection of MA type for the panel moving average
- Source: Selection of MA source(close, open etc) for the panel moving average
Feedback & Bug Report
if you found any bug in this indicator or any suggestion, please let me know. Please give feedback & appreciate it if you like to see more future updates and indicators. Thank you
CryptoSignalScanner - Advanced Moving Averages - Cross & RainbowDESCRIPTION:
With this script you can plot 6 moving averages.
You can decide which Moving Average you want to show or hide.
For every plot you can decide to display the Simple Moving Average ( SMA ) or Exponential Moving Average ( EMA ).
It provides CrossOver and CrossUnder labels when loading the script. Those labels you can show or hide.
You have the possibility to show or hide the rainbow colors. This rainbow function gives you a clear view of the current trend.
HOW TO USE:
• When one Moving Average crosses above another Moving Average it signals an uptrend.
• When one Moving Average crosses below another Moving Average it signals a downtrend.
• The higher to length of the Moving Average the stronger the trend.
FEATURES:
• You can show/hide the preferred Moving Averages.
• You can set the length, type and source for every Moving Average.
• You can show/hide the rainbow colors.
• You can show/hide the CrossUp labels.
• You can show/hide the CrossDown labels.
• You can set alerts for every Moving Average.
• Etc...
DEFAULT SETTINGS:
• MA1 => EMA5
• MA2 => EMA10
• MA3 => EMA20
• MA4 => SMA50
• MA5 => SMA100
• MA6 => SMA200
Simple Moving Average vs. Exponential Moving Average:
SMA and EMA are calculated differently. The exponential moving average ( EMA ) focuses more on recent prices than on a long series of data points, as the simple moving average required.
The calculation makes the EMA quicker to react to price changes and the SMA react slower. That is the main difference between the two.
One is not necessarily better than another. It comes down to personal preference. Plot an EMA and SMA of the same length on a chart and see which one helps you make better trading decisions.
Moving Average Trading Strategies:
The first strategy is a price crossover, when the price crosses above or below a moving average, it signals a potential change in trend.
The second strategy applies when one moving averages crosses another moving average.
• When the short-term MA crosses above the long-term MA, it signals a buy signal.
• When the short-term MA crosses below the long-term MA, it signals a sell signal.
REMARKS:
• This advice is NOT financial advice.
• We do not provide personal investment advice and we are not a qualified licensed investment advisor.
• All information found here, including any ideas, opinions, views, predictions, forecasts, commentaries, suggestions, or stock picks, expressed or implied herein, are for informational, entertainment or educational purposes only and should not be construed as personal investment advice.
• We will not and cannot be held liable for any actions you take as a result of anything you read here.
• We only provide this information to help you make a better decision.
• While the information provided is believed to be accurate, it may include errors or inaccuracies.
If you like this script please donate some coins to share your appreciation.
Good Luck,
SEOCO
RSI Forecast [Titans_Invest]RSI Forecast
Introducing one of the most impressive RSI indicators ever created – arguably the best on TradingView, and potentially the best in the world.
RSI Forecast is a visionary evolution of the classic RSI, merging powerful customization with groundbreaking predictive capabilities. While preserving the core principles of traditional RSI, it takes analysis to the next level by allowing users to anticipate potential future RSI movements.
Real-Time RSI Forecasting:
For the first time ever, an RSI indicator integrates linear regression using the least squares method to accurately forecast the future behavior of the RSI. This innovation empowers traders to stay one step ahead of the market with forward-looking insight.
Highly Customizable:
Easily adapt the indicator to your personal trading style. Fine-tune a variety of parameters to generate signals perfectly aligned with your strategy.
Innovative, Unique, and Powerful:
This is the world’s first RSI Forecast to apply this predictive approach using least squares linear regression. A truly elite-level tool designed for traders who want a real edge in the market.
⯁ SCIENTIFIC BASIS LINEAR REGRESSION
Linear Regression is a fundamental method of statistics and machine learning, used to model the relationship between a dependent variable y and one or more independent variables 𝑥.
The general formula for a simple linear regression is given by:
y = β₀ + β₁x + ε
Where:
y = is the predicted variable (e.g. future value of RSI)
x = is the explanatory variable (e.g. time or bar index)
β0 = is the intercept (value of 𝑦 when 𝑥 = 0)
𝛽1 = is the slope of the line (rate of change)
ε = is the random error term
The goal is to estimate the coefficients 𝛽0 and 𝛽1 so as to minimize the sum of the squared errors — the so-called Random Error Method Least Squares.
⯁ LEAST SQUARES ESTIMATION
To minimize the error between predicted and observed values, we use the following formulas:
β₁ = /
β₀ = ȳ - β₁x̄
Where:
∑ = sum
x̄ = mean of x
ȳ = mean of y
x_i, y_i = individual values of the variables.
Where:
x_i and y_i are the means of the independent and dependent variables, respectively.
i ranges from 1 to n, the number of observations.
These equations guarantee the best linear unbiased estimator, according to the Gauss-Markov theorem, assuming homoscedasticity and linearity.
⯁ LINEAR REGRESSION IN MACHINE LEARNING
Linear regression is one of the cornerstones of supervised learning. Its simplicity and ability to generate accurate quantitative predictions make it essential in AI systems, predictive algorithms, time series analysis, and automated trading strategies.
By applying this model to the RSI, you are literally putting artificial intelligence at the heart of a classic indicator, bringing a new dimension to technical analysis.
⯁ VISUAL INTERPRETATION
Imagine an RSI time series like this:
Time →
RSI →
The regression line will smooth these values and extend them n periods into the future, creating a predicted trajectory based on the historical moment. This line becomes the predicted RSI, which can be crossed with the actual RSI to generate more intelligent signals.
⯁ SUMMARY OF SCIENTIFIC CONCEPTS USED
Linear Regression Models the relationship between variables using a straight line.
Least Squares Minimizes the sum of squared errors between prediction and reality.
Time Series Forecasting Estimates future values based on historical data.
Supervised Learning Trains models to predict outputs from known inputs.
Statistical Smoothing Reduces noise and reveals underlying trends.
⯁ WHY THIS INDICATOR IS REVOLUTIONARY
Scientifically-based: Based on statistical theory and mathematical inference.
Unprecedented: First public RSI with least squares predictive modeling.
Intelligent: Built with machine learning logic.
Practical: Generates forward-thinking signals.
Customizable: Flexible for any trading strategy.
⯁ CONCLUSION
By combining RSI with linear regression, this indicator allows a trader to predict market momentum, not just follow it.
RSI Forecast is not just an indicator — it is a scientific breakthrough in technical analysis technology.
⯁ Example of simple linear regression, which has one independent variable:
⯁ In linear regression, observations ( red ) are considered to be the result of random deviations ( green ) from an underlying relationship ( blue ) between a dependent variable ( y ) and an independent variable ( x ).
⯁ Visualizing heteroscedasticity in a scatterplot against 100 random fitted values using Matlab:
⯁ The data sets in the Anscombe's quartet are designed to have approximately the same linear regression line (as well as nearly identical means, standard deviations, and correlations) but are graphically very different. This illustrates the pitfalls of relying solely on a fitted model to understand the relationship between variables.
⯁ The result of fitting a set of data points with a quadratic function:
_______________________________________________________________________
🥇 This is the world’s first RSI indicator with: Linear Regression for Forecasting 🥇_______________________________________________________________________
_________________________________________________
🔮 Linear Regression: PineScript Technical Parameters 🔮
_________________________________________________
Forecast Types:
• Flat: Assumes prices will remain the same.
• Linreg: Makes a 'Linear Regression' forecast for n periods.
Technical Information:
ta.linreg (built-in function)
Linear regression curve. A line that best fits the specified prices over a user-defined time period. It is calculated using the least squares method. The result of this function is calculated using the formula: linreg = intercept + slope * (length - 1 - offset), where intercept and slope are the values calculated using the least squares method on the source series.
Syntax:
• Function: ta.linreg()
Parameters:
• source: Source price series.
• length: Number of bars (period).
• offset: Offset.
• return: Linear regression curve.
This function has been cleverly applied to the RSI, making it capable of projecting future values based on past statistical trends.
______________________________________________________
______________________________________________________
⯁ WHAT IS THE RSI❓
The Relative Strength Index (RSI) is a technical analysis indicator developed by J. Welles Wilder. It measures the magnitude of recent price movements to evaluate overbought or oversold conditions in a market. The RSI is an oscillator that ranges from 0 to 100 and is commonly used to identify potential reversal points, as well as the strength of a trend.
⯁ HOW TO USE THE RSI❓
The RSI is calculated based on average gains and losses over a specified period (usually 14 periods). It is plotted on a scale from 0 to 100 and includes three main zones:
• Overbought: When the RSI is above 70, indicating that the asset may be overbought.
• Oversold: When the RSI is below 30, indicating that the asset may be oversold.
• Neutral Zone: Between 30 and 70, where there is no clear signal of overbought or oversold conditions.
______________________________________________________
______________________________________________________
⯁ ENTRY CONDITIONS
The conditions below are fully flexible and allow for complete customization of the signal.
______________________________________________________
______________________________________________________
🔹 CONDITIONS TO BUY 📈
______________________________________________________
• Signal Validity: The signal will remain valid for X bars .
• Signal Sequence: Configurable as AND or OR .
📈 RSI Conditions:
🔹 RSI > Upper
🔹 RSI < Upper
🔹 RSI > Lower
🔹 RSI < Lower
🔹 RSI > Middle
🔹 RSI < Middle
🔹 RSI > MA
🔹 RSI < MA
📈 MA Conditions:
🔹 MA > Upper
🔹 MA < Upper
🔹 MA > Lower
🔹 MA < Lower
📈 Crossovers:
🔹 RSI (Crossover) Upper
🔹 RSI (Crossunder) Upper
🔹 RSI (Crossover) Lower
🔹 RSI (Crossunder) Lower
🔹 RSI (Crossover) Middle
🔹 RSI (Crossunder) Middle
🔹 RSI (Crossover) MA
🔹 RSI (Crossunder) MA
🔹 MA (Crossover) Upper
🔹 MA (Crossunder) Upper
🔹 MA (Crossover) Lower
🔹 MA (Crossunder) Lower
📈 RSI Divergences:
🔹 RSI Divergence Bull
🔹 RSI Divergence Bear
📈 RSI Forecast:
🔮 RSI (Crossover) MA Forecast
🔮 RSI (Crossunder) MA Forecast
______________________________________________________
______________________________________________________
🔸 CONDITIONS TO SELL 📉
______________________________________________________
• Signal Validity: The signal will remain valid for X bars .
• Signal Sequence: Configurable as AND or OR .
📉 RSI Conditions:
🔸 RSI > Upper
🔸 RSI < Upper
🔸 RSI > Lower
🔸 RSI < Lower
🔸 RSI > Middle
🔸 RSI < Middle
🔸 RSI > MA
🔸 RSI < MA
📉 MA Conditions:
🔸 MA > Upper
🔸 MA < Upper
🔸 MA > Lower
🔸 MA < Lower
📉 Crossovers:
🔸 RSI (Crossover) Upper
🔸 RSI (Crossunder) Upper
🔸 RSI (Crossover) Lower
🔸 RSI (Crossunder) Lower
🔸 RSI (Crossover) Middle
🔸 RSI (Crossunder) Middle
🔸 RSI (Crossover) MA
🔸 RSI (Crossunder) MA
🔸 MA (Crossover) Upper
🔸 MA (Crossunder) Upper
🔸 MA (Crossover) Lower
🔸 MA (Crossunder) Lower
📉 RSI Divergences:
🔸 RSI Divergence Bull
🔸 RSI Divergence Bear
📉 RSI Forecast:
🔮 RSI (Crossover) MA Forecast
🔮 RSI (Crossunder) MA Forecast
______________________________________________________
______________________________________________________
🤖 AUTOMATION 🤖
• You can automate the BUY and SELL signals of this indicator.
______________________________________________________
______________________________________________________
⯁ UNIQUE FEATURES
______________________________________________________
Linear Regression: (Forecast)
Signal Validity: The signal will remain valid for X bars
Signal Sequence: Configurable as AND/OR
Condition Table: BUY/SELL
Condition Labels: BUY/SELL
Plot Labels in the Graph Above: BUY/SELL
Automate and Monitor Signals/Alerts: BUY/SELL
Linear Regression (Forecast)
Signal Validity: The signal will remain valid for X bars
Signal Sequence: Configurable as AND/OR
Condition Table: BUY/SELL
Condition Labels: BUY/SELL
Plot Labels in the Graph Above: BUY/SELL
Automate and Monitor Signals/Alerts: BUY/SELL
______________________________________________________
📜 SCRIPT : RSI Forecast
🎴 Art by : @Titans_Invest & @DiFlip
👨💻 Dev by : @Titans_Invest & @DiFlip
🎑 Titans Invest — The Wizards Without Gloves 🧤
✨ Enjoy!
______________________________________________________
o Mission 🗺
• Inspire Traders to manifest Magic in the Market.
o Vision 𐓏
• To elevate collective Energy 𐓷𐓏
Malama's big MACDPurpose: Malama's Big MACD is a multi-faceted Pine Script indicator designed for traders on short timeframes (1-5 minute charts) to identify high-probability trading opportunities. It combines a Stochastic Price Predictor (SPP) with a comprehensive set of technical indicators, including MACD, RSI, moving average crossovers, ATR, volume spikes, and a custom JKH RSI, to generate robust buy and sell signals. The indicator aims to solve the problem of filtering out market noise in fast-moving markets by integrating probability-based predictions with traditional technical analysis, providing traders with clear entry/exit signals, trend visualization, and risk management levels.
Originality and Usefulness
This script is a unique mashup of a Stochastic Price Predictor (SPP) and a comprehensive indicator suite, tailored for short-term trading. The SPP uses a Monte Carlo simulation combined with ATR and Stochastic RSI to forecast price movements, while the comprehensive indicator suite leverages MACD crossovers, RSI overbought/oversold conditions, moving average crossovers, volume spikes, and a custom JKH RSI for confirmation. Unlike standalone MACD or RSI indicators available in TradingView’s public library, this script’s originality lies in its hybrid approach, blending probabilistic forecasting with multiple confirmatory signals to enhance reliability. The integration of user-defined sentiment input and customizable risk management levels further differentiates it from generic open-source alternatives, making it particularly useful for scalpers and day traders seeking precise, actionable signals.
How It Works
The script operates in two primary modules: the Stochastic Price Predictor (SPP) and the Comprehensive Indicator Suite, which work together to generate and confirm trading signals. Signal strength is calculated to quantify the confidence of bullish or bearish conditions.
Stochastic Price Predictor (SPP):
Core Logic: The SPP forecasts price movements using a Monte Carlo simulation based on historical returns, ATR-based volatility, and Stochastic RSI filtering. It calculates the probability of price reaching a user-defined target move (default: 0.3%) within a specified forecast horizon (default: 3 bars).
Components:
ATR and Volatility: ATR (Average True Range) is calculated over a user-defined lookback period (default: 5) and scaled by a volatility factor (default: 1.5) to estimate price volatility. A volatility ratio (current volatility vs. average) filters out signals during extreme volatility (>2x average).
Stochastic RSI: A 7-period RSI is smoothed into a Stochastic RSI (5-period stochastic, 2-period SMA) to identify overbought (>85) or oversold (<15) conditions, preventing signals in extreme market states.
Monte Carlo Simulation: 30 price paths are simulated using a geometric Brownian motion model, incorporating drift (based on weighted moving average of returns) and volatility shocks. The simulation estimates the probability of price reaching the target move up or down.
Signal Generation: A buy signal is triggered if the probability of an upward move exceeds the confidence threshold (default: 65%) and the market is not overbought, with volatility within limits. A sell signal is triggered similarly for downward moves.
Purpose: The SPP provides a probabilistic framework to anticipate short-term price movements, reducing reliance on lagging indicators.
Comprehensive Indicator Suite:
Core Logic: This module combines multiple technical indicators to confirm SPP signals and generate independent signals based on momentum, trend, and volume.
Components:
MACD: Uses fast (5-period) and slow (13-period) EMAs to calculate the MACD line, smoothed by a 5-period signal line. A crossover above a threshold (default: 0.0001) indicates bullish momentum, while a crossunder signals bearish momentum.
RSI: A 14-period RSI identifies overbought (>70) or oversold (<30) conditions to filter signals.
Moving Average Crossovers: Fast (5-period) and slow (20-period) EMAs determine trend direction. A bullish crossover (fast > slow) supports buy signals, while a bearish crossover (fast < slow) supports sell signals.
Volume Spikes: Volume exceeding 2x the 50-period average signals significant market activity, enhancing signal reliability.
JKH RSI: A fast 3-period RSI with custom overbought (>80) and oversold (<20) levels provides additional confirmation, reducing false signals in choppy markets.
Sentiment Input: A user-defined sentiment score (-1 to 1) adjusts signal strength, allowing traders to incorporate external market bias (e.g., news or fundamentals).
Signal Generation: A buy signal requires a bullish MACD crossover, RSI oversold, bullish MA crossover, non-overbought JKH RSI, and neutral/positive sentiment. A sell signal requires the opposite conditions.
Signal Strength Calculation:
Logic: Combines SPP probability, RSI deviation, and MACD strength, weighted at 50%, 30%, and 20%, respectively. Sentiment input scales the final strength (0–100).
Formula:
Bullish strength = min(100, (50 * |prob_up - prob_down| / 100 + 30 * |RSI - 50| / 50 + 20 * |MACD_line| / (0.1 * ATR)) * (1 + max(0, sentiment)))
Bearish strength is calculated similarly, using the absolute negative sentiment.
Purpose: Quantifies signal confidence, helping traders prioritize high-probability setups.
Strategy Results and Risk Management
While the script is primarily an indicator, it provides implied trading signals that assume realistic trading conditions:
Assumptions: Signals are designed for short-term trading (1-5 minute charts) with a minimum of 100 trades for statistical significance. The script assumes typical commission (e.g., 0.1% per trade) and slippage (e.g., 0.05%) for liquid markets. Risk per trade is implicitly capped via ATR-based stop-loss levels (2x ATR below/above entry for buy/sell).
Default Settings:
Lookback (5), volatility factor (1.5), and forecast horizon (3) are optimized for short timeframes.
ATR-based stop-loss and profit target levels (2x ATR) provide a risk-reward ratio of approximately 1:1.
Confidence threshold (65%) balances signal frequency and reliability.
Customization: Traders can adjust the ATR multiplier for stop-loss/profit targets or modify the confidence threshold to increase/decrease signal frequency. Lowering the target move (e.g., to 0.2%) or shortening the forecast horizon (e.g., to 2 bars) can tighten risk parameters for scalping.
Guidance: Traders should backtest signals on their specific asset and timeframe, ensuring sufficient trade volume (>100 trades) and incorporating their broker’s commission/slippage. Risk should be limited to 5–10% of equity per trade, adjustable via ATR multiplier or position sizing outside the script.
User Settings and Customization
The script offers extensive user inputs, organized into three groups:
Stochastic Price Predictor Settings:
Lookback Period (default: 5): Controls the period for ATR and returns calculation. Shorter periods increase sensitivity.
Volatility Factor (default: 1.5): Scales ATR for volatility shocks in the Monte Carlo simulation.
Confidence Threshold (default: 65%): Sets the minimum probability for SPP signals.
Stoch RSI Overbought/Oversold Levels (default: 85/15): Filters signals in extreme conditions.
Forecast Horizon (default: 3): Number of bars for price prediction.
Target Move (default: 0.3%): Expected price movement for probability calculation.
Show Predicted Range (default: false): Toggles visibility of the 25th–75th percentile price range.
Comprehensive Indicator Settings:
RSI Length (default: 14), Overbought (70), Oversold (30): Standard RSI parameters.
ATR Length (default: 14): Period for ATR calculation.
Volume Spike Multiplier (default: 2.0): Threshold for detecting volume spikes.
Sentiment Input (default: 0.0, range: -1 to 1): Scales signal strength based on external bias.
MACD Fast/Slow/Signal Lengths (default: 5/13/5), Crossover Threshold (0.0001): Controls MACD sensitivity.
MA Fast/Slow Lengths (default: 5/20): Defines trend direction.
JKH RSI Length (default: 3), Overbought (80), Oversold (20): Fast RSI for confirmation.
Visual Settings:
Show SPP Signals (default: true): Displays SPP buy/sell labels.
Show Comp Signals (default: true): Displays comprehensive indicator signals.
Highlight Volume Spikes (default: true): Highlights bars with significant volume.
Show ATR Levels (default: true): Plots stop-loss and profit-target lines.
Impact: Adjusting lookback periods or thresholds affects signal frequency and sensitivity. For example, lowering the confidence threshold increases signals but may reduce accuracy, while increasing the volatility factor amplifies price path variability.
Visualizations and Chart Setup
The script plots clear, relevant elements on the chart to aid decision-making:
Trend Line: Plots the close price, colored green (bullish, fast MA > slow MA), red (bearish), or orange (neutral).
SPP Signals: Green "BUY (SPP)" labels below bars and red "SELL (SPP)" labels above bars when conditions are met.
Predicted Range: Optional blue step lines showing the 25th–75th percentile price range from the Monte Carlo simulation, with a semi-transparent fill.
Comprehensive Signals:
Blue upward triangles for bullish MACD crossovers, orange downward triangles for bearish crossovers.
Green circles above bars for RSI overbought, red circles below for oversold.
Green "BUY (Comp)" labels (offset by 1x ATR below) and red "SELL (Comp)" labels (offset by 1x ATR above) for comprehensive signals.
Green upward triangles for bullish MA crossovers, red downward triangles for bearish crossovers.
Volume Spikes: Yellow background highlights bars with volume >2x the 50-period average.
ATR Levels: Purple dotted lines for stop-loss (close - 2x ATR) and profit target (close + 2x ATR).
Moving Averages: Fast MA (blue, 5-period) and slow MA (red, 20-period) for trend reference.
Clarity: Only relevant elements are plotted, ensuring traders can quickly identify trends, signals, and risk levels without clutter.